
Your server is the lifeblood of your organization: it manages services that are depended on by both your employees and customers. But these programs are running silently in the background, so how will you know when one of them goes down? You’re not going to sit at the terminal all day checking, and writing a custom script for each one gets rather complex.
The easier answer is to use Uptime Kuma. It will monitor your services and send you notifications when they go down. In this tutorial, I’ll give you step-by-step instructions on how to install and configure Uptime Kuma.
Best Features of Uptime Kuma
Here are what I consider the best features of Uptime Kuma:
- Monitors all types of services
- Notification methods covering close to 100 different messaging services
- Customizable status pages that can be shared with teams or customers
- Self-hosted for full control and data privacy
- Free and open-source
Want to save time and skip the steps below? Try our 1-click installer for Uptime Kuma for free on the LifeinCloud marketplace.
How to Install Uptime Kuma on Ubuntu Server 24.04
Although it’s possible to install Uptime Kuma via the system package manager, it often requires newer versions of dependencies (Node.js, npm, pm2) that you might not want integrated with the rest of your server. And since I may need Uptime Kuma across different platforms, I think it’s a great case for running it as a container.
So I’ll be showing you how to install Uptime Kuma as a container with Docker Compose.
1. Install Docker
Here’s a quick way to install Docker: curl -sSL https://get.docker.com | sh
sudo usermod -aG docker $USER
Log out and log back in, or else the next commands will return errors.
(For a more in-depth explanation, check out our guide to Docker.)
Test if Docker is working: docker run hello-world
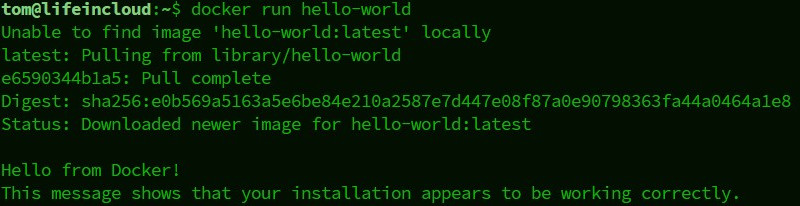
Now you’ve got Docker (and Docker Compose) installed.
2. Create a Docker Compose YAML for Uptime Kuma
Next, we’re going to write a Docker Compose file, which is a user-friendly way to define a container’s configuration.
Make a folder to store the container: mkdir uptime-kuma
Create a Docker Compose YAML file for Uptime Kuma:nano uptime-kuma/compose.yaml
Paste in the following lines (the indentation matters!):
services:
 uptime-kuma:
 image: louislam/uptime-kuma:1
 volumes:
   - ./data:/app/data
   - /var/run/docker.sock:/var/run/docker.sock
 ports:
   - 3001:3001
 restart: unless-stopped
Save & exit (CTRL+X, Y, Enter).
If you’re curious, these lines tell Docker to:
- Download the official Uptime Kuma container image.
- Listen on port 3001.
- Create a ‘data’ folder in the current directory to store the app’s files.
- /var/run/docker.sock:/var/run/docker.sock is optional. It allows monitoring services that may be running inside other Docker containers.
If you know your way around Docker, feel free to change these lines to suit your system configuration.
3. Deploy the Uptime Kuma Container
Enter the folder containing the Compose YAML:cd uptime-kuma
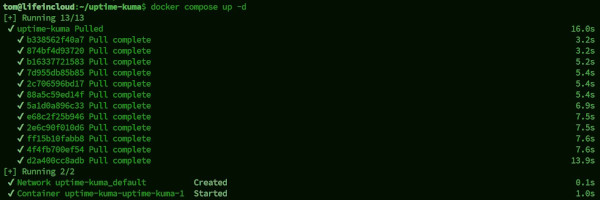
Launch Uptime Kuma with Docker: docker compose up -d
Docker will do its magic, pulling files and starting the container in the background.
That completes the installation! In the next section, you’ll learn how to use Uptime Kuma.
Getting Started with Uptime Kuma
Now that you’ve got Uptime Kuma installed, I’ll show you how to monitor services and get notifications if something goes down unexpectedly.
1. Log In to the Web Interface
To visit the admin panel, find your server’s IP address.
(It can be found on your host control panel, or sometimes by running the ip a command.)
Point a web browser to your server on port 3001.
For example, http://154.46.33.124:3001 (replace 154.46.33.124 with your server’s IP.)
You should see Uptime Kuma’s login screen:
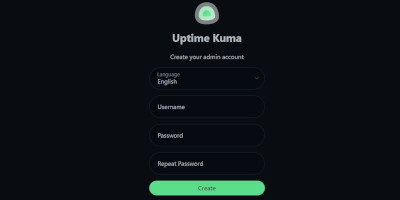
(If the page won’t load, see our FAQ below.)
Create a username and password, and you’re in!
2. Create a Service Monitor
As an example, let’s use Uptime Kuma to notify us when our website goes offline.
Click Add New Monitor and input these settings:
- Monitor Type: HTTP(s).
- Friendly Name: what you want to call it.
- URL: the website address to monitor.
- Heartbeat interval: how often you want to check on its status.
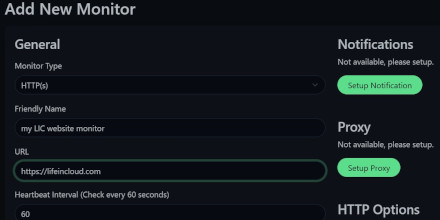
Hit Save.
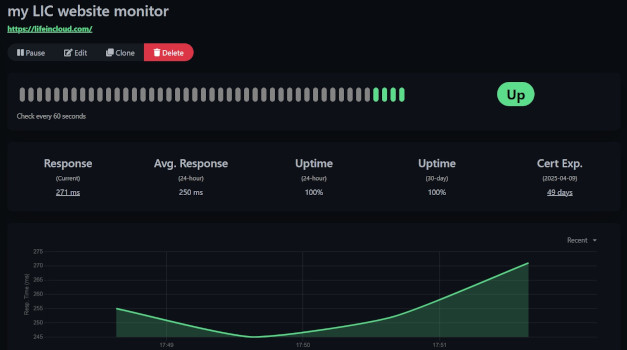
Now it’s on your dashboard, and you can select the monitor you’ve created to see the live status.
(It can even watch for the expiration of your website’s SSL certificate.)
Repeat these steps for other services you want to track.
For more tips on creating monitors for other types of services, see our FAQ below.
3. Enable Notifications
If Uptime Kuma detects a service outage, how will you know about it?
Easy, just set up an alert.
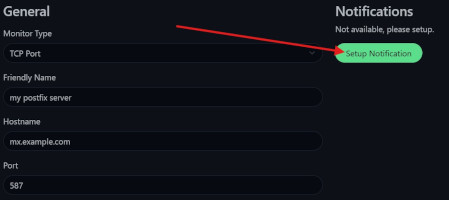
Add a new monitor, or edit an existing monitor, and click Setup Notification.
Choose your preferred communication channel, such as:
- Text SMS
- Slack
- Discord
There are many more options to choose from.
Depending on which method you choose, you’ll need to enter details to establish the connection:
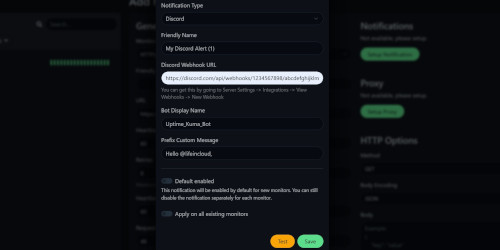
Hit Test to check if the notification works. Once you’ve verified it, hit Save.
You’re all done! Now, when a service goes down, you’ll get a notification. Instead of finding out about it from an angry phone call, you can pick up and say, “I knew half an hour ago, and I’ve almost fixed the issue.” Now that’s dependable.
FAQ for Uptime Kuma
Why won’t Uptime Kuma’s web interface load in my browser?
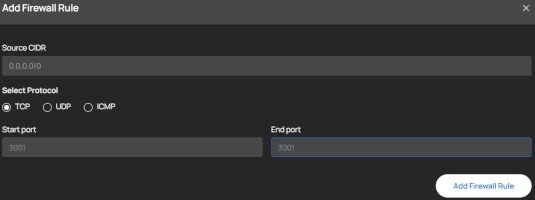
You probably need to open TCP traffic to the default port 3001 on your firewall.
(Or, if you’re on our platform, configure the LifeinCloud firewall interface.)
How do I create monitors for other types of services?
Here are some tips for common types of service monitors:
- Database server: set Type to MySQL/MariaDB and enter database login details.
- VS Code server: set Type to HTTP and include port 8080 in the URL.
- Email server: set Type to TCP and port to match SMTP/IMAP/POP3 as needed.
- Minecraft server: set Type to TCP and port as 25565.
To monitor more complex setups not covered by the default methods, like OpenVPN, you may have to set Type to Push and define a custom API call.