Skip the setup and launch instantly with our ready-to-use templates.
cPanel is a web hosting control panel for managing websites, domains, and server settings.
WireGuard is a fast, modern VPN protocol for secure, encrypted network connections.
Node.js is a runtime environment for executing JavaScript code server-side to build fast web applications.
Django is a high-level Python web framework for building secure, scalable, and fast web applications.
LAMP is a web server stack with Linux, Apache, MySQL, and PHP for hosting websites.
MsSQL is a relational database management system for storing, querying, and managing structured data.
Our servers are fine-tuned to give your software the resources it needs for peak performance. Application settings are preconfigured to run efficiently, reducing unnecessary resource usage and helping you save time and costs.
Every application template in LifeinCloud is tested to run seamlessly on our infrastructure. You get a stable, pre-configured environment that works right out of the box, without the hassle of manual setup or troubleshooting.
With LifeinCloud’s pre-installed software, you skip lengthy setup and configuration. Your server is ready from the moment it’s deployed, so you can focus on building, scaling, and managing your projects instead of spending time on installations.
All pre-installed software is sourced from trusted providers, verified malware-free, and kept up to date with the latest versions. This keeps your environment secure from the start, reduces vulnerabilities, and protects your workloads.
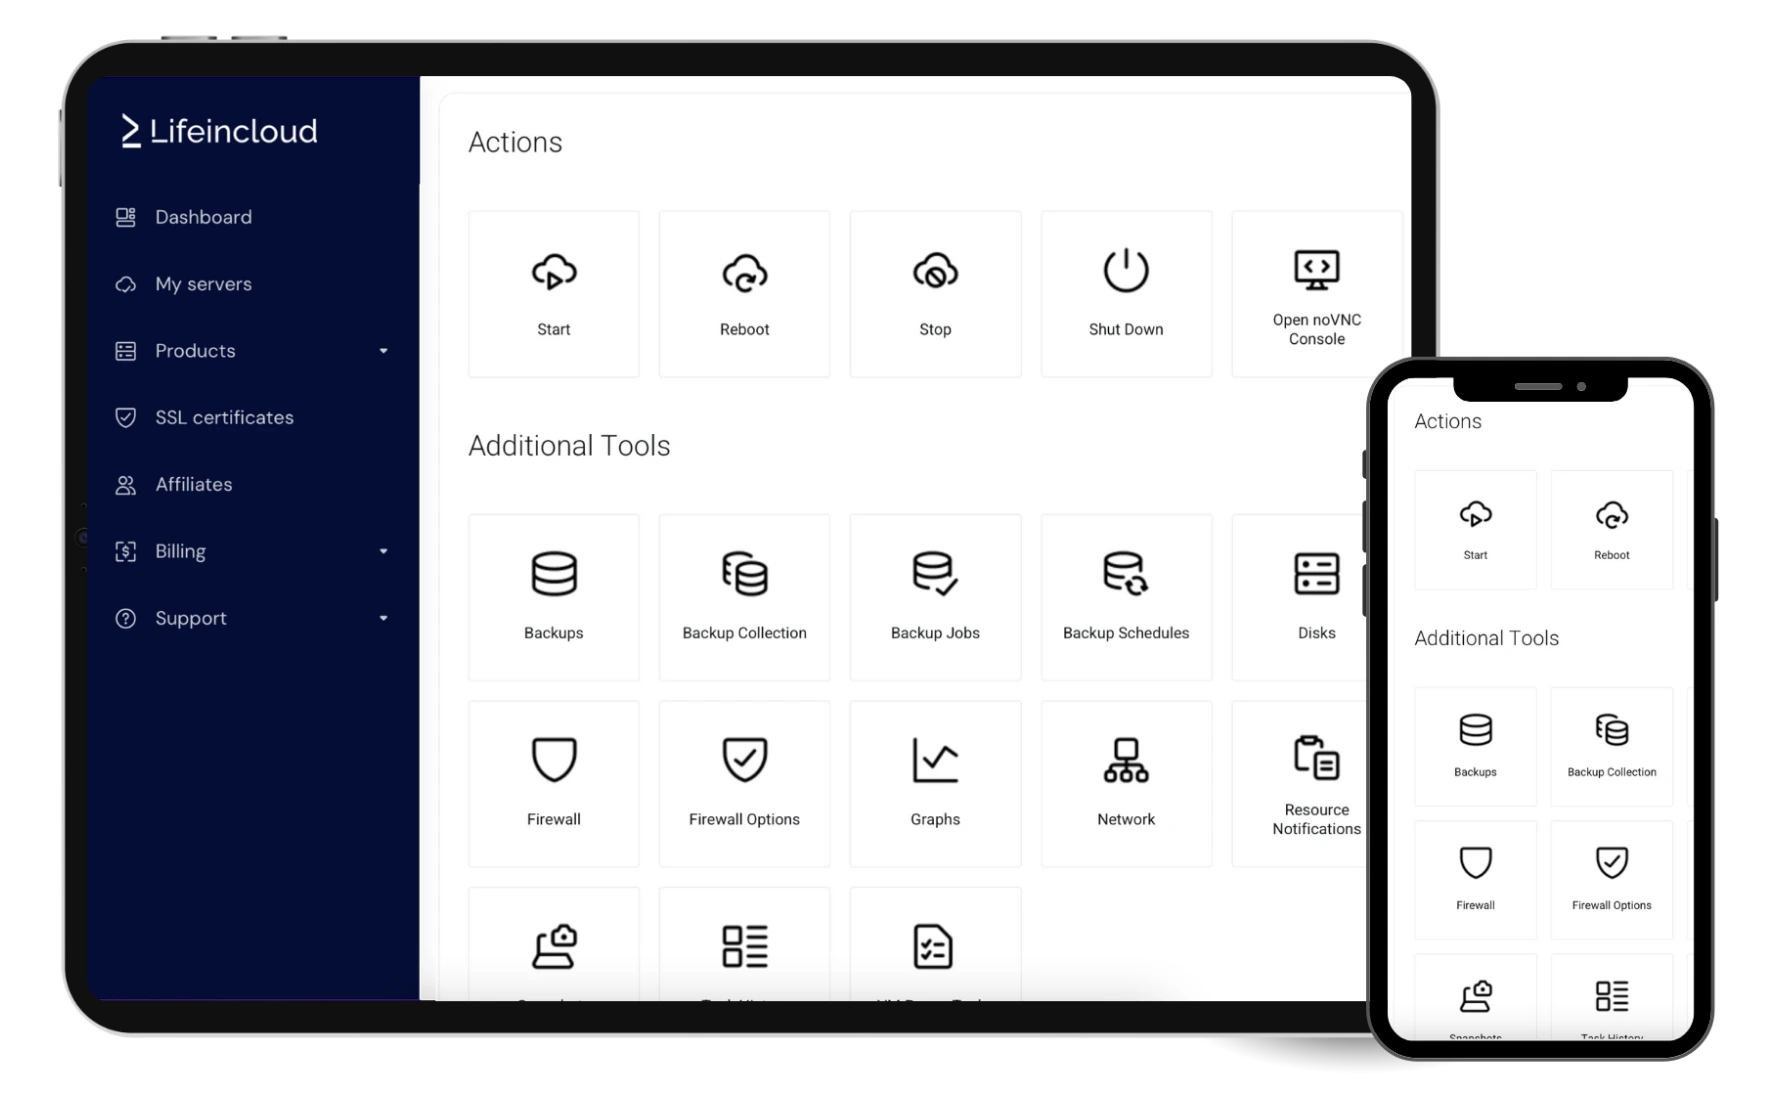
Deploy, monitor, and manage your VPS in seconds from a clean, intuitive dashboard. Backups, snapshots, user access, security and resource management are all in one place.
Built for speed and simplicity, the LifeinCloud control panel keeps you focused on your projects while we handle the platform.
Easily track your usage, scale resources as needed, and manage all payments from a single, clean, and intuitive dashboard.
Secure, high-quality datacenters designed for reliable and stable performance.
Basic L3 and L4 protection filters malicious traffic before it reaches your server.
We were with a US-based provider, before migrating staging to Lifeincloud over a year ago and have since migrated production too. So far it's been flawless, from performance to support. Congrats!

LifeinCloud offers a wide range of ready-to-use templates, including popular Linux distributions, Windows Server, and pre-installed applications such as WordPress, Magento, and more.
You can also upload a custom ISO to install your own OS or software stack.
Yes. With full root access, you have complete freedom to configure your LifeinCloud VPS for almost any purpose—whether it’s running high-performance applications, deploying AI models, or building custom automation workflows. You control every aspect of the server and can allocate resources exactly how you need.
We also offer leading control panels such as cPanel, Plesk, CyberPanel, and DirectAdmin, giving you intuitive tools for monitoring, managing resources, and keeping your VPS running smoothly. Whether you’re launching a website, application, or fully custom project, our Linux and Windows templates help you start fast.
With 1-click installation for both operating systems and software, you’ll have a ready-to-use hosting environment in minutes.

LifeinCloud delivers high-performance cloud VPS hosting that’s fast, simple, and affordable. From developer-ready servers to GPU and game hosting, all powered by NVMe speed and enterprise-grade processors.
LifeinCloud LTD is a company registered in England and Wales, company No. 15844051. London W1S 1HN, United Kingdom.


